

Science dive-in: physics fueling computer vision
Clarke’s Third Law says that “Any sufficiently advanced technology is indistinguishable from magic”. We would rather say that any advanced technology is a kind of art.
There are two parts to this idea. The first part of the art lies, of course, in the beauty of the results, that’s the side that Clarke was talking about. The second part is related to the process of solving the particular technological problem, it can be seen in the way the beautiful solutions are born from a holistic view of the universe and human knowledge.
Our computer vision engineers work in the field where both these principles are really easy to observe. And today our R&D team, spearheaded by Alex Makoveychuk will show us how they are inspired by art to seek beautiful solutions and apply physics laws to solve complex Computer vision problems.
How we approach unfamiliar problems
Almost all R&D projects are a kind of experiments where you often don’t exactly know where you are going and whether there’s a solution.
So how do we approach this sort of unfamiliar problems?
- First, when dealing with a complex multidimensional data, you have to make sense of it. You can spend a couple of hours trying to understand the data and save yourself a couple of days (or weeks even) of fruitless development work.
- The second idea is that you should look for beauty. The most beautiful solution to the problem is surprisingly often the best one.
- And another idea that really helps us is remembering to look for inspiration in other fields of human knowledge. You never know where the spark may come from.
We want to show you some examples based on our actual experiments, where ideas from evolution, special relativity and graph theories have been efficiently used to solve video processing tasks.
So how can Charles Darwin, Albert Einstein, and Leonhard Euler help us with computer vision problems?
How Evolution Theory helps us understand multidimensional data
The first example is about Evolution theory and the difficulties with understanding multidimensional data.
Majority of modern problems involves a huge amount of data. And not only the number of data points in your data set may be huge, but a number of features which describe each of these data points may be huge, too. This is what is called a multidimensional data.
You can imagine this data as a giant spreadsheet where rows are data points, and columns are features, and the number of columns is very large. The problem is that this sort of multidimensional tabular data is hard to understand.
If we want to make a quick progress with the task at hand, we want to be able to see the structure in the data, to notice some regularities – or irregularities – in it, maybe see outliers or some forming clusters among data points. Of course, you can try to start using hard math, build models, etc, and that’s fine. But we can just try to see it, literally. Visual thinking is a very powerful tool for a scientist!
So here’s an idea, what if instead of spreadsheets, we can use a certain visual representation of a multidimensional space that is very familiar to us.
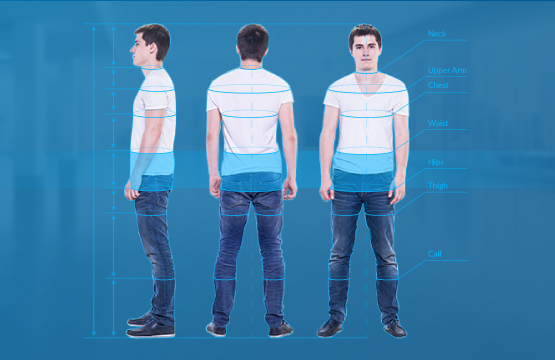
Experiment: Body measurement and making sense of countless numbers
Let’s look at the following experiment.
We want to be able to estimate body measurements of a person based on a short video clip with this person and one or two simple measurements such as height and waist circumference. How can this be done? We can gather data – go and measure real people – and that train a model using some ML approach.
This sounds easy. The problem is that our model may become overfitted to the data that we have, especially if we have outliers – people like Tyrion Lannister or Gregor Clegane.
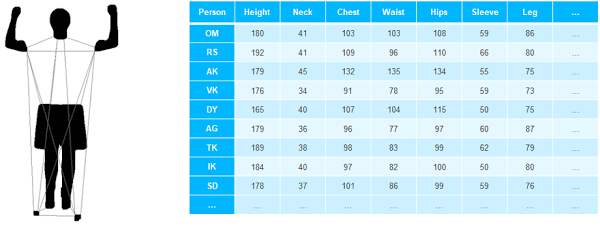
We have here a spreadsheet with body measurements of a group of people. The first row is the person’s data, you can see his silhouette to the left of the table. Then we have other people’s measurements – height, neck, chest, and so on.
Can you spot outliers in this data without using any math?
Here’s one way to do it.
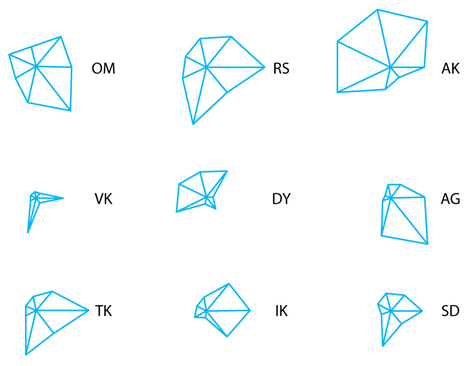
What you see here is called star diagrams. They are frequently used for quick visual data assessment.
Here each feature – each particular measurement from the table from the previous slide – is a radial line in a data point’s star-like diagram.
The numerical value of the feature corresponds to the length of the spoke.
This representation already shows us that serious variance is present in the dataset. Some stars are much larger (or smaller) than the others, and the overall shape is clearly not uniform. We are making progress with understanding the data, right?
But this representation isn’t without problems:
- First, It’s hard to track features, especially of different scale. All spokes look alike, and it’s hard to compare a person’s height to the neck circumference. Data normalization can’t completely eliminate this problem.
- Also, it is hard to describe shapes in a meaningful way, which means that it’s hard to reason with them. Especially when the number of features is high, even only larger than five.
Can we use something more familiar to us, more meaningful than just spokes in a star diagram?
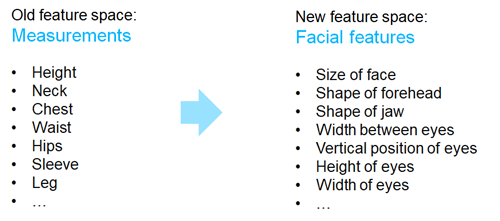
Mapping feature space to a new and better one
Old feature space:
Measurements
Luckily, evolution has provided us with the incredibly powerful visual analyzer that is fine-tuned to recognizing features of human faces.
American mathematician Herman Chernoff used this fact to develop a famous system for multidimensional data visualization, where data dimensions were mapped to facial features.
Instead of stars, let’s draw faces, remapping measurements to facial features, as shown in the slide. So height becomes the size of the face, neck circumference corresponds to the shape of the forehead, and so on.
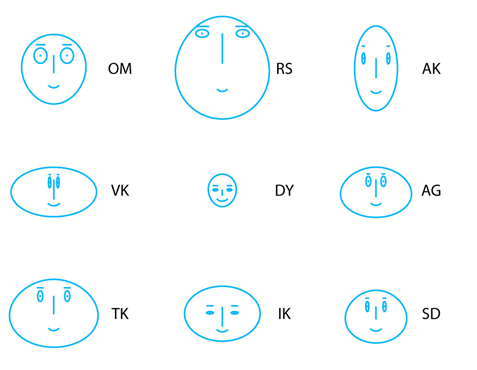
So how will our data look in Chernoff’s faces representation? Here’s how.
What are the benefits here?
- It is easy to spot outliers. Central face, for example.
- It’s easy to spot common features and how they are forming clusters by face size or shape, for example.
- It provides a meaningful ‘cast’ for the multidimensional data point.
- Face visualization instantly makes much more sense.
- It is easier to compare and discuss the data.
We don’t exactly understand why or how this works on a biological level, but it does. Darwin’s theory suggests that it has something to do with the fact that as a result of millions of years of evolution the human brain has acquired an extraordinary ability to process features of human faces because it was needed for living in society.
So what’s the lesson here?
It’s possible to visualize and make sense of multidimensional data. You just have to find a proper representation, preferably the one supported by your brain’s ‘software’ and ‘hardware’.
How Special Relativity Theory helps us with counting things
Here’s another example of how other domains of knowledge come to help with CV related tasks.
Experiment: Counting buns on bakery conveyor belt
This experiment is about counting the objects.
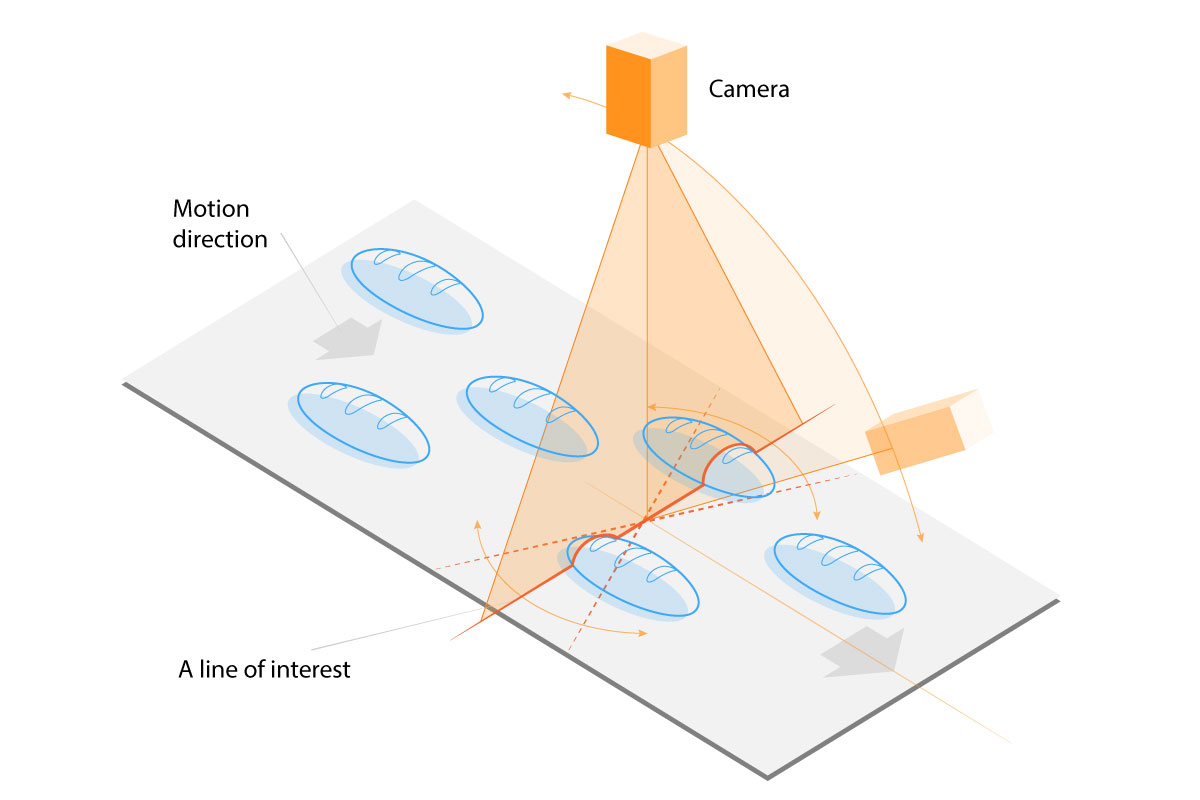
Imagine a conveyor belt in a bakery: buns are moving on the belt, and we need to count them with a certain accuracy.
Our solution will be, of course, based on computer vision. We will need a camera to shoot the video of the buns which cross a predefined line. The slide shows how it’s usually done: we obtain a video, then we try to track the buns and count their trajectories while they are crossing the counting line. And this method works. Well, for the most part.
What are the issues?
- Tracking objects is hard
- Computational cost is high
Different types of objects require different solutions – monetary cost is high, too. The method is sensitive to accurate object tracking, and tracking objects in time from frame to frame is hard. The computational cost of this task is high, which increases the monetary cost. Additionally, we would really like our solution to be universal. But different types of objects require different solutions – the need to develop all these solutions is making the monetary cost even higher.
Here’s where Einstein’s ideas from SRT come to help: instead of frame-by-frame representation let’s use a space-time cube representation.
The montage of sequential frames must be processed in a frame-by-frame order.
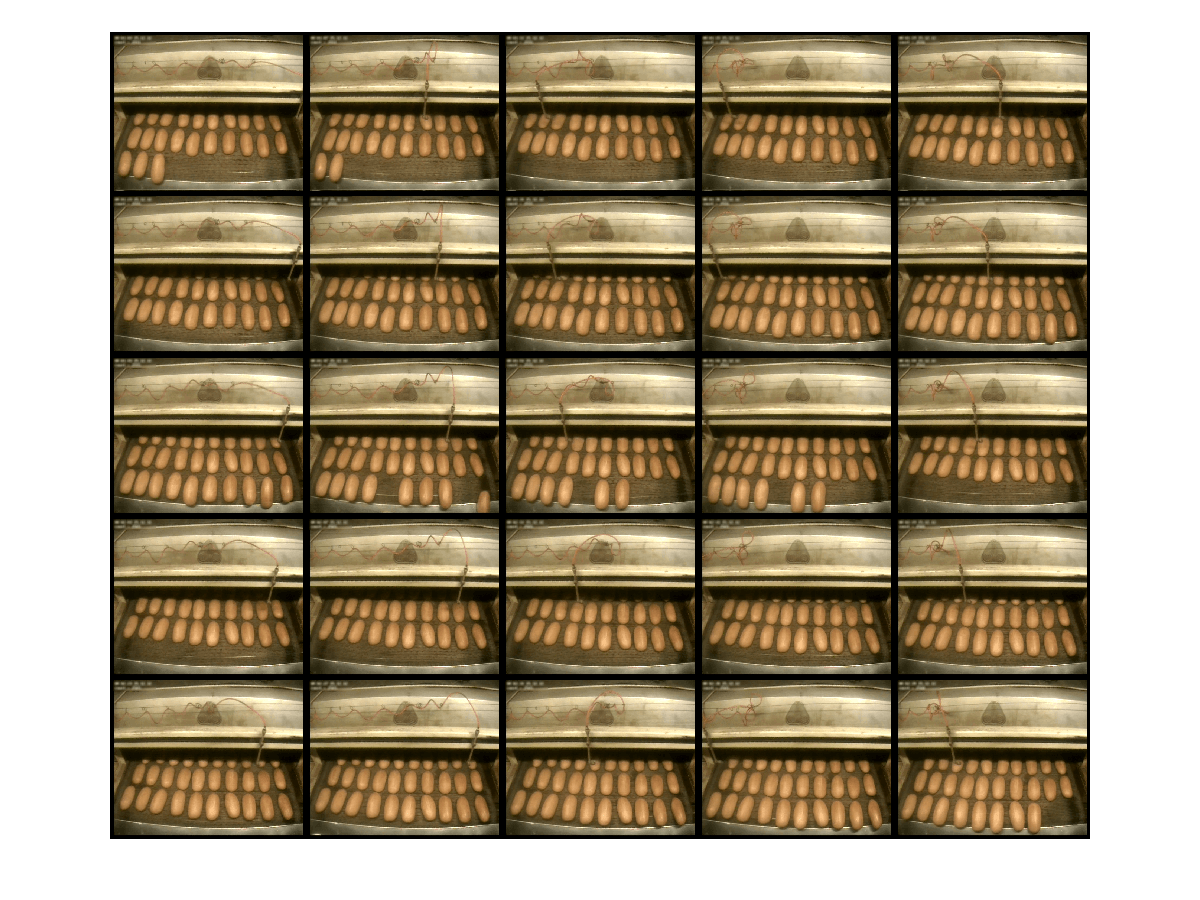
A Traditional approach where every frame is analyzed individually requires identification and tracking of every bun or car, which is a very computationally demanding task, bringing down the final counting accuracy.
On the other hand, we can count these objects on the side of the hypercube after cutting it along the counting line. This allows us to move from counting in 3D, as we did in a traditional approach, to counting in 2D. This significantly simplifies the task and increases accuracy. Computationally, this also means that every frame we have to process only one row of pixels instead of the whole image. This reduces computational cost by a factor of one thousand.
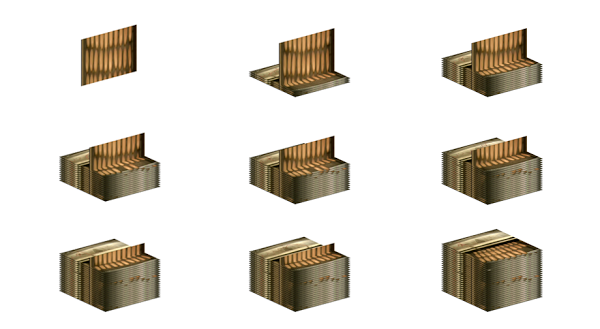
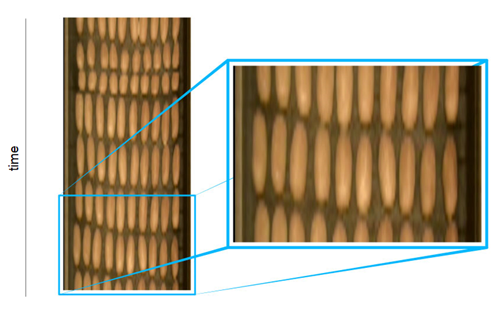
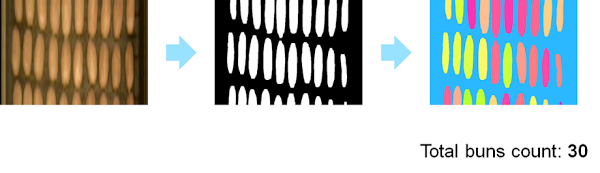
We can think of the video clip not as of a sequence of 2D-frames following each other as the time flies, but, in the spirit of the SRT, as of a hyper-cube, composed of the 2D-frames stacked one above the other along the third dimension – time, similar to how post-it-notes are stacked in a block. This idea provides us with a surprisingly effective algorithm for counting moving objects which cross a certain line. As you can see, we no longer need to track every bun. Instead of many frames we now have only one long image with all the buns at once.
Those of you who have seen movie Arrival or read the Ted Chiang’s story which the movie is based upon may recognize the similarity between our new representation and the holistic way in which heptapods the aliens perceived our world. Of course, we still have to count buns, but that part is easy.
How universal is this approach? What else can we count? People. Cars. Anything that crosses the line!
Experiment: Counting vehicles
Here’s how the algorithm can be applied to the task of counting vehicles crossing the intersection exit.
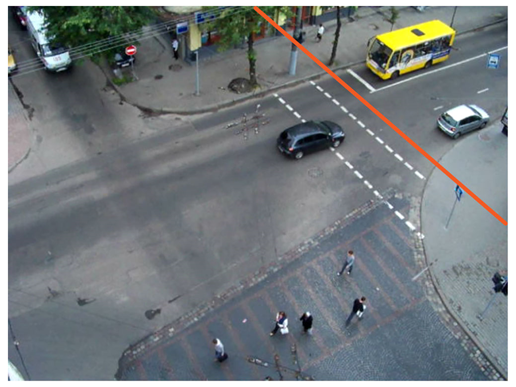
All we need is to determine a counting line. It doesn’t even have to be parallel to the edges of the frame.
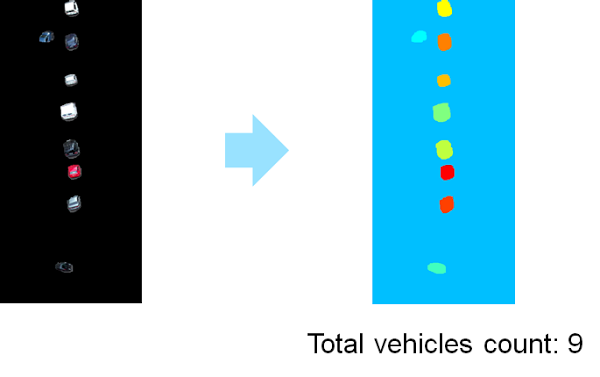
Here on the left side is the output of the algorithm, and you can see how it looks similar to the buns on the belt.
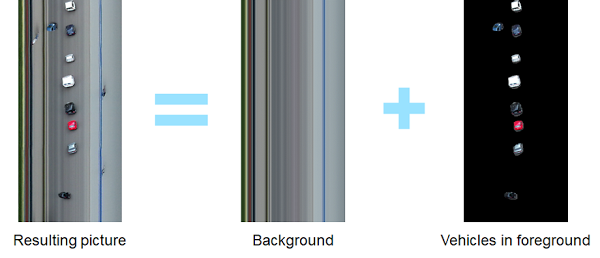
Even a much more complex background isn’t a problem for us: it can be estimated and later removed by simple averaging of pixels in time.
You can also see how the smaller objects such as people or dogs can be filtered out by their size, so we are only left with vehicles in the rightmost picture.
Also note how, almost in the spirit of the SRT, the length of the objects doesn’t accurately correspond to their physical length. It shrinks in the time coordinate for fast-moving objects.
Now we can easily count the vehicles.
So once again, this approach is rather universal.
It’s fast, it’s very low-cost computationally, and it can be used to count anything that moves.
You just have to think of the video clip as a hypercube composed of the 2D frames stacked one above the other.
By the way, you can see how technology and art get entangled. This same approach was used by New York artist Jay Mark Johnson to produce a beautiful picture of the dancer.

How Graph Theory helps us with image segmentation
At the beginning we mentioned Euler. And now we’ll show how his ideas about graphs can be applied in Computer Vision for efficient image segmentation and background removal.
Segmentation is a process of finding segments within the image. Parts of the image contained by segments are similar in a certain way – they may have a similar colour or a common boundary. Segmentation is a fundamental part of computer vision. Look how in the previous example we are segmenting the hypercube slices to count the buns or vehicles.
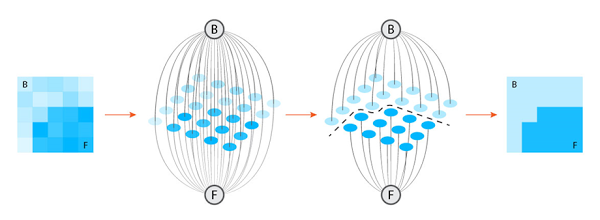
There exists a great number of different methods of image segmentation. And the problem with them is that the fastest of these algorithms are inaccurate, while the most accurate ones are really slow. We, of course, want to have the best of both worlds. To achieve this we will need to look at the image from a different perspective: instead of treating the image as a matrix of pixels, we look at it as a graph.
A graph is a structure built out of a number of objects (usually called nodes). Nodes are connected pairwise by the edges. Edges represent relations between the nodes and sometimes have numerical values – weights – assigned to them. Here’s a graph representation of a 4-dimensional hypercube, the tesseract.
It’s not easy to imagine a 4-dimensional object, but graphs still let us build its model.
Now how is it useful?
Let’s get back to the matrix of pixels. Consider each pixel to be a node of the graph connected to its neighbors by the edges. For segmentation purposes, we look at the foreground and background in the picture. Each pixel can belong to either the foreground or the background – with some probability. On the other hand, we can look at each pixel’s affinity to its neighbors.
These two observations let us play with the picture as with a graph and reformulate the segmentation task in terms of graph theory. And this problem is well known and has an effective solution – Max-flow min-cut theorem. Now image segmentation becomes finding a way to cut the corresponding graph. Below you can see rough steps of the process: we move from image pixels to nodes, then we find the cut, and then we obtain a well-segmented image.
The binary foreground-background segmentation can be generalized to multiple types of segments. The next experiment demonstrates the usefulness of segment-based processing as opposed to whole image processing.
Experiment: Background removal
Here’s another experiment demonstrating the power of graph-based image segmentation. This time we work with video. Here’s a frame from the video clip of a surfer in the waves, and we want to separate her from the background.

You can see how the water and foam in the background are completely removed from every frame. Note how the surfer’s shadow becomes part of the foreground. It can be removed too, of course.
To conclude
When dealing with some hard problem, you should take a step back and look at it from the perspectives of other domains of human knowledge. This may provide results that are effective and beautiful at the same time. You never know if the best solution is hiding on another side of your book shelf.
Another conclusion is that we must not forget the importance of a holistic way of looking at the world around us.
During the last years, you may have heard many times this notion that most of what you are taught in school is useless and you’ll never apply it in your life. We strongly disagree with this idea. Quite the contrary, we think that every part of your school knowledge is useful and important. And you can and should be applying this knowledge to the problems.
The Universe around us is just beautiful. And the math – the science – is a perfect instrument helping us truly see this beauty.