


FinTech DevOps: AWS for microservices architecture – a guide

The idea of the project was to build an artificial intelligence customer service automation solution for the client that works in the fintech industry. The project processes a big amount of sensitive data, which is why the security aspect was very important during software development and further support of the customer service automation solution. The main goal is to process data from a few third-parties and store it to the other remote service. It adds additional difficulties to the task of building a secure and reliable communication between all the involved sides.
Project requirements overview
To build a secure, scalable, and maintainable platform, we identified several key requirements for the DevOps infrastructure:
- the system should run code written in several different programming languages;
- the system should securely connect to external back-office software systems;
- the platform should automatically scale to handle increasing workloads;
- security should be incorporated at every level, including application security, request filtering, secure environments, encrypted communication, patch management, and continuous monitoring;
- development environment setup and application deployment should be as automated and straightforward as possible.
Based on these requirements, we decided to build the solution around the following principles:
- microservices architecture;
- each service isolated in its own Docker container;
- Kubernetes as the container orchestration platform;
- AWS as the cloud infrastructure provider.
High-level architecture overview
Each microservice represents the smallest functional block of the system and is responsible for a single business capability. Every microservice is packaged into an individual Docker container, allowing us to deploy multiple instances independently whenever additional computing resources are required.
To make independent scaling possible, all microservices are designed to be stateless. Instead of storing data inside containers, they use centralized databases or storage services that remain available regardless of how many container instances are running.
This architecture allows us to add new microservices without affecting the rest of the platform, provided every service follows the same deployment standards and communication patterns.
To support this approach, we selected the following AWS services and monitoring tools:
- AWS Elastic Container Registry (ECR) for storing Docker images;
- AWS Elastic Kubernetes Service (EKS) for orchestrating containerized workloads;
- AWS Application Load Balancer (ALB) for routing incoming traffic;
- AWS CloudWatch for infrastructure monitoring and alerting;
- AWS Elasticsearch with Kibana for centralized log storage and visualization;
- Prometheus and Grafana for collecting and visualizing infrastructure and application metrics.
The high-level architecture is illustrated below.
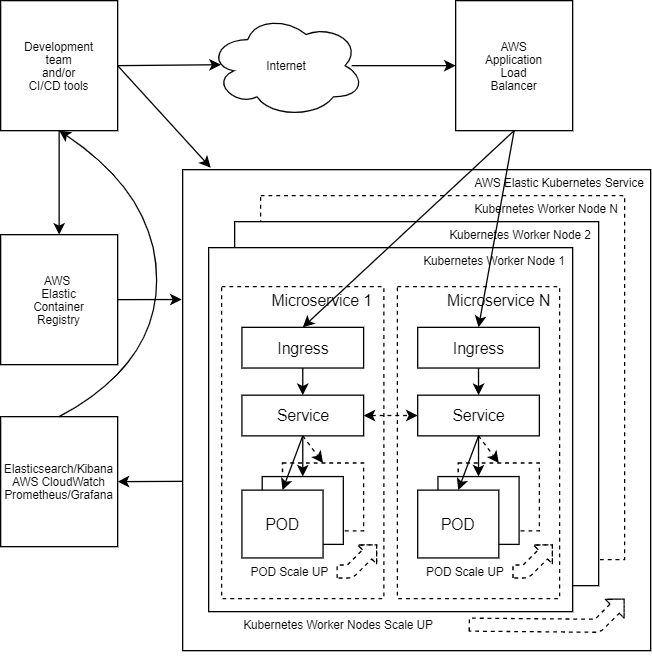
The Kubernetes cluster is deployed on AWS EKS and consists of multiple worker nodes capable of scaling automatically as workloads increase. Each microservice is built into a Docker image, uploaded to AWS ECR, and deployed to Kubernetes using standard deployment manifests.
Every deployment consists of several core Kubernetes resources:
- Deployment, which manages container lifecycle, scaling, and updates;
- Service, which provides stable networking between microservices inside the cluster;
- Ingress, which securely exposes selected services outside the cluster through AWS Application Load Balancer.
When a deployment is updated, Kubernetes automatically pulls the latest Docker image from AWS ECR, starts new containers, and replaces outdated instances without interrupting the application.
Infrastructure components continuously monitor the environment. Cluster Autoscaler adds or removes worker nodes based on resource demand, while CloudWatch, Elasticsearch, Prometheus, and Grafana collect logs, metrics, and alerts that help the engineering team monitor the health of the platform.
Secure communication
Because the platform processes highly sensitive financial information, security became one of the primary architectural priorities from the very beginning.
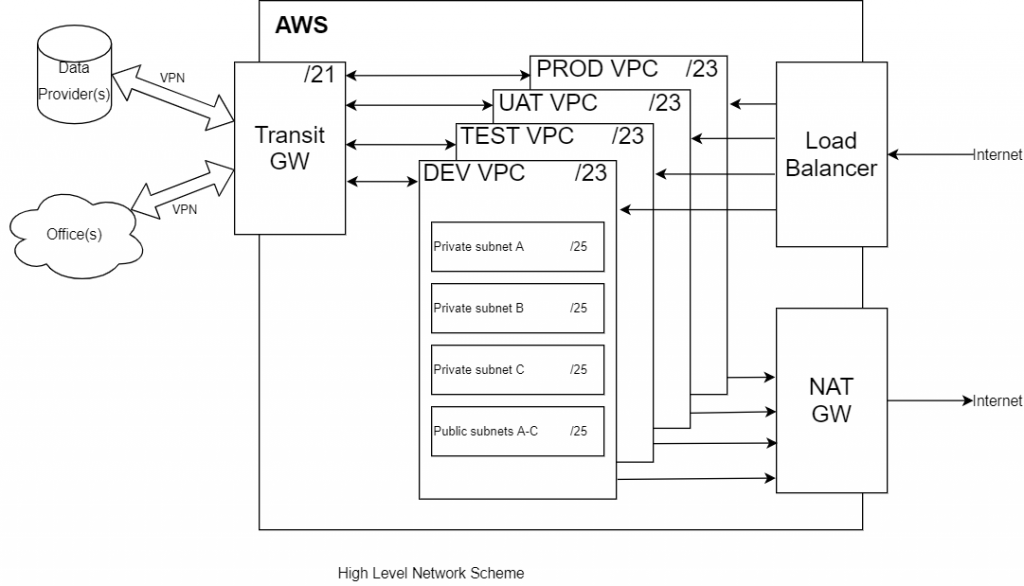
The solution consists of several hosting environments that serve different purposes throughout the software development lifecycle. Each environment is fully isolated to prevent unwanted communication between development, testing, and production systems.
Development team members receive access only to the environments required for their responsibilities. Communication with external data providers and customer offices is protected through IPSec VPN tunnels, while permissions are restricted according to the environment, external partner, and developer role.
To further strengthen security, every environment is deployed inside its own isolated AWS Virtual Private Cloud (VPC). Private networking minimizes the attack surface, while Internet access for production workloads is restricted. Where outbound Internet communication is required, it is routed through dedicated gateways rather than exposing application workloads directly.
This networking model provides a transparent and manageable infrastructure where encrypted communication, strict access control, and environment isolation work together to protect sensitive financial data while maintaining reliable connectivity with third-party services.
Centralized logging
Running dozens of microservices across multiple Kubernetes nodes generates a significant amount of application and infrastructure logs. Without a centralized logging system, troubleshooting issues or tracing requests across services quickly becomes difficult.
To address this challenge, we implemented the Elastic Stack (EFK), which collects, stores, searches, and visualizes logs from every microservice deployed in the Kubernetes cluster.
The logging workflow consists of the following components:
- Fluentd runs on every Kubernetes worker node and collects logs generated by Docker containers and Kubernetes services.
- Elasticsearch stores and indexes the collected log data, making it searchable for troubleshooting and analysis.
- Kibana provides dashboards and visualization tools for reviewing application behavior, investigating incidents, and monitoring system health.
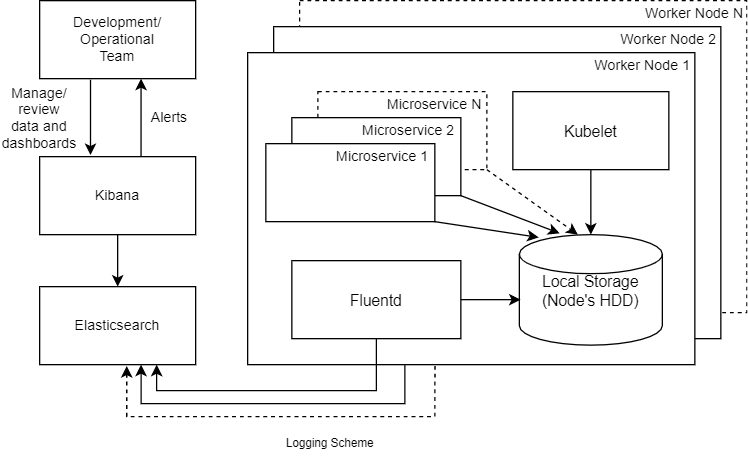
In addition to application logs, infrastructure events generated by AWS services such as CloudWatch and CloudTrail can also be forwarded to Elasticsearch. This creates a single centralized logging platform that simplifies monitoring, debugging, auditing, and long-term system maintenance.
With monitoring, networking, and logging in place, the next step was designing a deployment workflow that would keep the platform secure, scalable, and easy to maintain.
Application configuration
With a microservice-based approach, managing application configuration is always a challenge. Each of the microservices requires a set of parameters to run, like database connection strings, external API credentials or application-specific logical values. Some of these parameters are environment-specific, while others are shared between all services.
Since every microservice runs inside its own Docker container and may be written in a different programming language, the most universal way to distribute configuration is through environment variables.
For centralized configuration management, we selected AWS Secrets Manager, where all configuration values are stored in JSON format. During deployment, the CI/CD pipeline retrieves the required configuration and injects it into the container, ensuring that sensitive information never becomes part of the application source code or Docker image.
Microservice parameters consist of several layers, each one overriding the previous one:
- Local configuration file, stored together with the source code and containing default parameter values.
- Shared configuration in AWS Secrets Manager, providing common environment-specific settings used across all microservices.
- Microservice-specific configuration in AWS Secrets Manager, overriding the previous layers whenever service-specific values are required.
This layered approach keeps configuration centralized while allowing every service to maintain its own custom settings without duplicating common values.
Kubernetes deployment tools
AWS EKS provides many Kubernetes capabilities out of the box, but additional tools are required to automate deployment, scaling, networking, and service discovery.
Our platform relies on several Kubernetes extensions that work together:
- Metrics Server supplies CPU and memory metrics used for autoscaling.
- Horizontal Pod Autoscaler (HPA) automatically adjusts the number of pod instances based on resource utilization.
- Cluster Autoscaler adds or removes Kubernetes worker nodes depending on overall cluster capacity.
- ExternalDNS automatically manages DNS records in AWS Route 53 based on Kubernetes resources.
- AWS Load Balancer Controller provisions and updates AWS Application Load Balancers directly from Kubernetes Ingress resources.
- Helm serves as the package manager that standardizes deployments across all microservices.
Together, these components automate much of the infrastructure management that would otherwise require manual intervention.
HELM chart
Helm packages all Kubernetes resources required by a microservice into a single reusable chart. Instead of maintaining multiple deployment manifests separately, Helm allows the entire deployment to be managed as one logical package whose behavior is controlled through a configuration file called Values.yaml.
During deployment, Helm renders Kubernetes manifests from templates and applies the configuration values appropriate for the target environment.
Each of our microservices follows the same Helm chart structure, which simplifies deployment regardless of the underlying programming language or business functionality.
The standard chart contains the following Kubernetes resources:
| Resource | Purpose |
|---|---|
| Deployment | Deploys and manages microservice instances, including health checks, resource allocation, and rolling updates. |
| ConfigMap & Secret | Store configuration values and sensitive settings separately, generating them automatically during deployment. |
| Service | Provides stable internal networking and service discovery inside the Kubernetes cluster. |
| Ingress | Exposes selected services externally through AWS Application Load Balancer. |
| Horizontal Pod Autoscaler (HPA) | Automatically scales the number of running pods based on CPU, memory, or custom metrics. |
As a result, a single Helm chart is responsible for deploying both the Kubernetes resources and the required AWS integrations for each microservice. We follow a simple principle: one Helm chart per microservice. This standardization significantly simplifies deployment, maintenance, and onboarding while allowing every service to evolve independently.
CI/CD pipeline
To support rapid development while maintaining stability across environments, we established a standardized CI/CD workflow for every microservice.
At the beginning of the project, we worked with four deployment environments:
- DEV – receives the latest changes for rapid testing and integration with local development environments.
- TEST – hosts release candidates for comprehensive testing by the QA team.
- UAT (User Acceptance Testing) – used to verify that the solution meets end-user expectations and business requirements.
- PROD – the production environment that hosts fully tested, production-ready releases.
Each microservice has its own Git repository containing everything required for development and deployment, including source code, Docker configuration, Helm charts, and CI/CD pipeline definitions. This modular approach keeps every service self-contained and simplifies maintenance as the platform grows.
Branching strategy
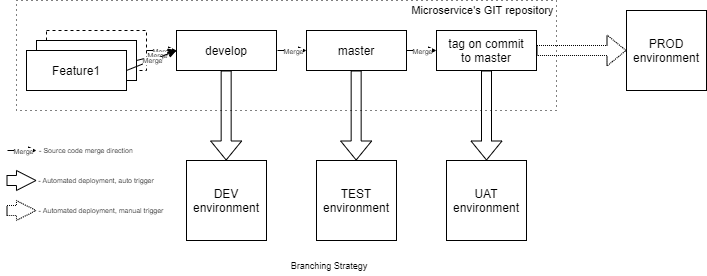
We adopted a straightforward continuous delivery workflow that supports both rapid feature development and controlled releases.
- Each new feature is developed in its own branch created from the develop branch. Once completed, it is merged back into develop.
- The develop branch always contains the latest integrated changes. Every merge automatically deploys the newest version to the DEV environment, allowing developers to validate new functionality and verify interaction between microservices.
- The master branch contains the next release candidate. Changes merged into this branch are automatically deployed to the TEST environment, where the QA team performs comprehensive validation.
- Once a version has been fully tested, it receives a release tag and becomes available for deployment to the UAT environment for final acceptance testing.
- Production deployments are performed manually by selecting one of the approved tagged releases, ensuring that only verified versions reach end users.
This strategy provides a balance between development speed and release stability while maintaining a consistent workflow across all microservices.
As the project matures, this workflow can gradually evolve from continuous delivery toward continuous deployment, enabling more environments—including production—to be updated automatically whenever quality gates are successfully passed.
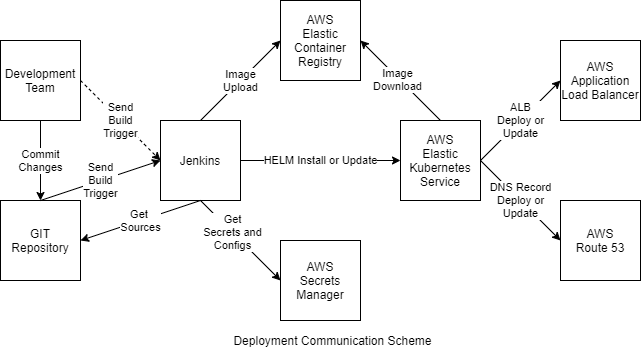
Automated deployment workflow
Automated deployment is responsible for preparing, validating, and delivering every microservice to the Kubernetes cluster.
Each deployment follows the same workflow:
- Receive a deployment trigger (automatic or manual).
- Download the latest source code.
- Retrieve environment-specific configuration from AWS Secrets Manager.
- Build the Docker image and execute automated build-time checks.
- Push the image to the Docker registry.
- Update the Helm chart with the new application version and configuration.
- Deploy or upgrade the microservice in Kubernetes.
- Allow Kubernetes and AWS services to provision or update the required infrastructure automatically.
- Execute post-deployment tests.
- Report deployment results to the development team.
This standardized process ensures that every deployment is repeatable, consistent, and fully traceable.
Jenkins implementation
We selected Jenkins as our CI/CD platform because of its flexibility, extensive plugin ecosystem, and strong support for Kubernetes-based deployments.
Each microservice uses its own multibranch pipeline, allowing Jenkins to automatically discover branches and execute the deployment instructions defined in a Jenkinsfile stored alongside the application’s source code.
This approach provides two important advantages:
- deployment logic remains version-controlled together with the microservice itself;
- any branch can be deployed to any environment when needed, making it easy to validate new features or investigate issues without disrupting the main development workflow.
During deployment, Jenkins combines configuration from several sources. Default application settings are packaged with the source code, environment-specific values are supplied through Helm, and sensitive information is securely retrieved from AWS Secrets Manager before being injected into the running containers.
Local development environment
The solution consists of a large number of microservices, and developers often need to work with several of them simultaneously. To simplify onboarding and day-to-day development, we created a standardized local development environment that mirrors the production platform as closely as possible.
The system is built using Docker, Docker Compose, and Bash scripts and is maintained in a dedicated Git repository. It supports Windows, Linux, and macOS, allowing every team member to work with the same setup regardless of their operating system.
Its main capabilities include:
- one-click deployment of the local development environment;
- selective deployment of only the required microservices;
- simplified rebuilding of individual services;
- bulk source code updates;
- automatic retrieval of configuration from AWS Secrets Manager;
- the ability to connect locally developed services with microservices running in the AWS DEV environment through an IPSec VPN tunnel.
Using Docker containers for local development makes the development environment closely resemble production, reducing configuration issues and deployment inconsistencies.
The standardized setup also makes onboarding significantly easier. New developers can prepare a fully functional environment within minutes instead of manually configuring dozens of services, while existing team members benefit from a consistent workflow regardless of the programming language or technology stack they work with.
Benefits of the architecture
Throughout the MVP development, we built a secure and scalable DevOps platform for a Kubernetes-hosted microservices architecture. By standardizing deployment, configuration management, and infrastructure automation, we established a foundation that can support both current business needs and future platform growth.
The resulting architecture provides several important benefits:
- Modular development – each microservice has its own repository containing everything related to that service, from source code and deployment configuration to CI/CD rules.
- High security – Docker container isolation, encrypted external communication, centralized monitoring, and restricted environments help protect sensitive financial data.
- Automatic horizontal scaling – Kubernetes automatically scales individual microservices according to demand, allowing the platform to efficiently handle changing workloads.
- Simplified Kubernetes deployments – standardized Helm charts make deploying and updating microservices consistent across the entire platform.
- Technology independence – because every service follows the same deployment model, programming language becomes an implementation detail rather than an operational concern.
- Rapid onboarding of new services – standardized repository templates, deployment pipelines, and infrastructure conventions make introducing new microservices fast and predictable.
- Centralized observability – integrated logging and monitoring provide complete visibility into application behavior, helping engineering teams identify and resolve issues quickly.
Future improvements
Like any modern cloud platform, the architecture continues to evolve as new requirements emerge. While the current implementation successfully meets the project’s goals, we identified several opportunities for further improvement.
One of the next logical steps is moving the local development environment from Docker Compose to a local Kubernetes cluster. This would make local development even closer to production and further reduce environment-specific issues.
Security can also be strengthened by introducing AWS Web Application Firewall (AWS WAF) to provide advanced HTTP request filtering and additional protection against common web attacks.
Monitoring and observability will continue to evolve as well. Planned improvements include richer dashboards, more intelligent alerting, additional infrastructure metrics, and better filtering of low-value log entries, allowing the support team to detect and resolve issues more proactively.
Finally, as the platform grows, the AWS Application Load Balancer strategy can be revisited to determine whether multiple per-service load balancers should be consolidated. This optimization could reduce infrastructure costs while maintaining the same level of reliability and scalability.
Summing up
During the MVP version development, we built a highly secure and scalable CI/CD and hosting solution for a Kubernetes-based microservices architecture running on AWS.
The platform combines containerization, Kubernetes orchestration, infrastructure automation, centralized configuration management, and standardized deployment pipelines into a unified DevOps ecosystem. Every environment, application component, and external integration is carefully isolated, helping protect sensitive financial data while maintaining reliable communication with third-party systems.
Automated deployments, standardized Helm charts, centralized logging, and comprehensive monitoring simplify day-to-day operations and allow engineering teams to deliver new functionality quickly without compromising stability or security.
As the platform continues to evolve, this architecture provides a solid foundation for expanding the solution, introducing additional microservices, and supporting increasing workloads while maintaining the reliability, scalability, and operational efficiency required for modern fintech applications.