Node-RED for enterprise-grade workflows in days, not months

Node-RED automation has transformed data processing from weeks into days by automating data ingestion, validation, cleaning, alignment, enrichment, and storage via a Node-RED pipeline along with Microsoft Fabric. This freed >60% of the time being allocated to routines and delivered the opportunity to focus on priorities.For the business itself, that meant a greater data reliability, faster delivery, higher confidence, and accuracy.
From tedious data wrangling to automated predictive analytics – how do you go beyond dashboards?
In the following overview, we will discuss how our client, a civil engineering company, went from a bottleneck in manual data processing to efficiency and paved the way to adopting predictive analytics.
The challenge: a manual data battle
A civil engineering firm was struggling with managing data processes: every day, the team was overwhelmed with gigabytes of records from numerous in-field sensors, all exported into cumbersome CSV and Excel files. Their highly skilled engineers were spending an estimated 60% of their time on repetitive low-value tasks (cleaning, resampling, filling gaps, aligning timestamps – all manually).
This chaos both created a serious operational bottleneck and eroded the confidence in their analytical models. Everyday workflows, being data-rich and insight-poor, were disrupting strategic decision-making and growth.
The solution: an automated data engine
We designed and implemented a drag-and-drop web console to replace their all-manual, error-prone process. The delivered web platform now empowers their engineers to handle data-related tasks by dropping a folder into the provided application.
A pre-built visual pipeline, built upon Node-RED technology, will execute the workflow, in particular:
- Data validation & cleaning, by detecting and correcting format issues and outliers
- Data alignment & enrichment, by resampling and syncing datasets across multiple sources
- Data visualization & storage
- by enabling instant analysis through generated flow-duration curves and hydrographs
- while storing structured datasets in the time-series database
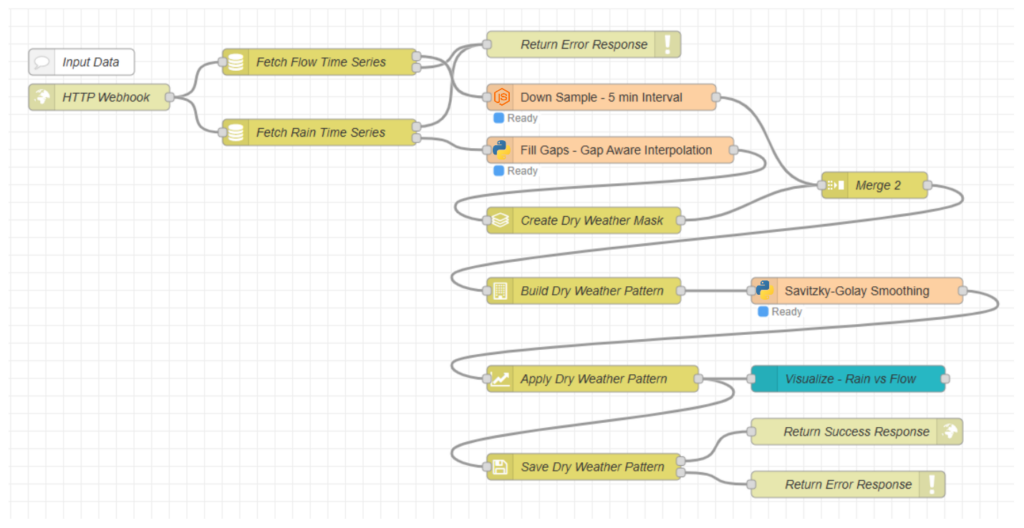
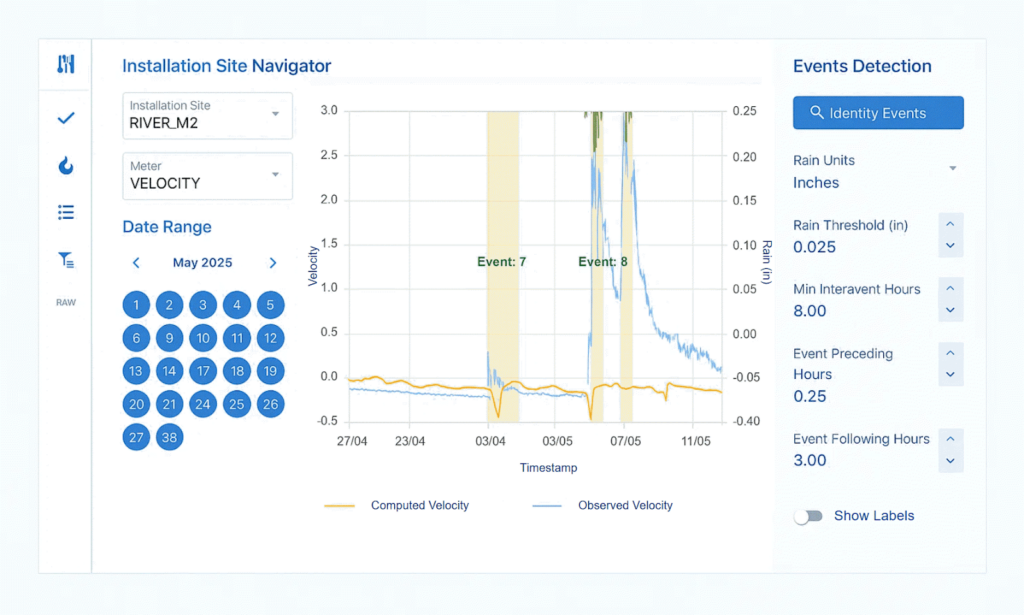
Node-RED is an open-source, flow-based tool that’s designed for event-driven data processing and automation. It’s nature is perfect for making quick changes, for example, easily adding visual nodes to enable ad-hoc analysis or tweaking the parameters in the Python script and seeing the results right away.
Node-RED provides great control without writing complex code, thus combining both speed and efficiency.
To explore some alternatives, go check out our recent overviews:
- Hyperautomation vs RPA technology, any difference?
- AI agents for straightforward business automation
- AI automation for smarter IT operations
- AI automation for hospitals – a must-have?
Node-RED driving workflow automation: the impact
The results we’ve seen were transformative: the platform instantly minimized the manual, complex workflows and freed 60% of allocated time and effort, thus allowing the engineers to focus on their top-priority processes. The tasks that caused most problems – cleaning, resampling, filling gaps, aligning timestamps – are automated.
That brought:
- More focus on priorities
- Data reliability
- Faster delivery
- Analytical accuracy
What began as resolving a bottleneck has evolved into providing an instant strategic advantage.
The platform can now be scaled to allow IoT sensor feed ingestion in real-time and third-party API integration. This unlocks the prospect for upcoming predictive analytics and new revenue streams.
Node-RED applications: workflow automation across domains
The methodology we suggest is well-suited for conditions that demand a real-time data integration & control:
Scenario 1: real-time logistics & cold chain fleet monitoring
A food distribution company is struggling with preservation and punctuality when delivering perishable goods. They lack real-time visibility into refrigerator truck fleets, which causes potential spoilage, partner disputes, and high fuel expenses coming from inefficient routes – all because of relying on periodic phone calls to drivers.
Our suggestion: a live truck fleet operation center – an entirely Node-RED-based solution.
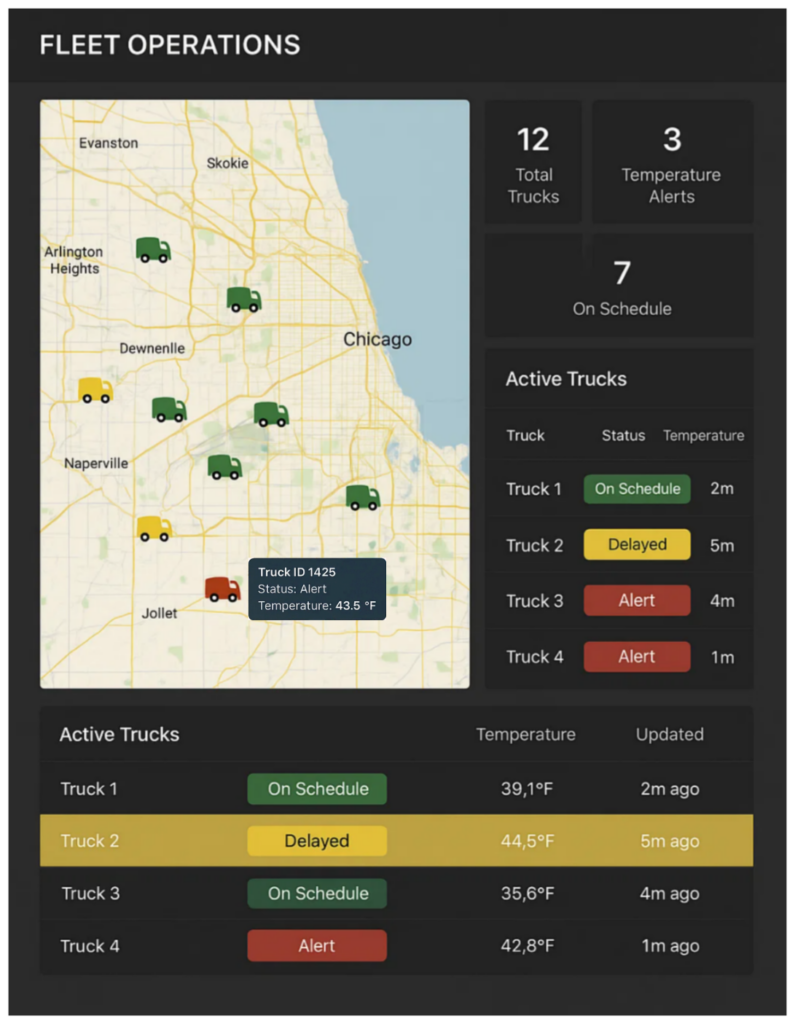
Real-time visibility through dashboards
Node-RED dashboards with world map nodes are used to visualize the exact GPS location of every truck out. Each icon (vehicle illustration) is color-coded to indicate the status (green color for on-schedule, yellow color for delayed, red color for alert).
An industrial IoT integration
Modbus sensors are integrated into refrigerator truck units to monitor the temperature throughout delivery; Node-Red flows are pulling the records and triggering according alerts via dashboards and SMS when needed. This approach can minimize potential spoilage by up to 25% by enabling immediate response to excursions.
And customer-focused ETA alerts
By using geofencing nodes, the system can detect truck units that approach their destination all automatically. This triggers ETA alerts, thus improving customer experience.
Scenario 2: smart building & energy management
A facility manager overseeing a multi-story office building is battling operational expenses and waste of energy. The integrated HVAC/lighting/security systems are from different vendors and thereby not interconnected – the energy is wasted while heating and cooling empty floors after hours, and identifying failing equipment entirely relies on traditional manual inspection.
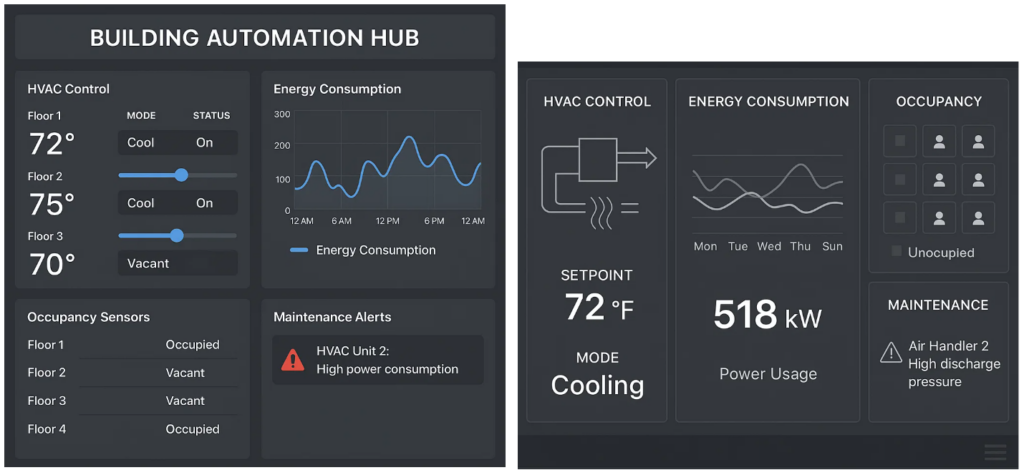
Our suggestion: a unified building hub for automation – the “central nervous system” of the office building.
Protocol integration
Node-RED communicates with the HVAC/lighting/security systems by using their native industrial protocols. Specific nodes are pulling data from the systems (HVAC – BACnet-controlled, lighting – Modbus-connected, occupancy sensors, and others) through their REST APIs.
Condition-based automation
The system will orchestrate energy-saving routines – for example, daily at 7 PM, it’ll check occupancy records. If there’s a floor being empty for over 30 minutes, it sends a command to the BACnet-controlled system to set the thermostat back automatically and turn off the main lights, thus cutting the cost of energy by up to 40%.
Predictive maintenance & monitoring
By analyzing real-time consumption from the Modbus-connected meters, the flow can detect missed anomalies. If a HVAC unit’s power draw suddenly spikes and remains too high, it flags a failure and creates a ticket in the maintenance system – the alert will be then displayed on the facility manager’s Node-RED Dashboard.
Scenario 3: laboratory equipment GXP monitoring & data integrity
A pharma QC lab is working with equipment from incubators to HPLCs, stability chambers, and bioreactors. These instruments, all from different originators, are isolated, and technicians are spending valuable time manually recording critical parameters to comply with strict GxP regulations.
An overnight temperature fluctuation in a stability chamber could remain unseen until the very next morning. This invalidates an entire long-term study, thus wasting valuable resources, and delaying the time-to-market – a serious operational risk.
Our suggestion: a hub for automatic lab equipment GXP monitoring to centralize the process.
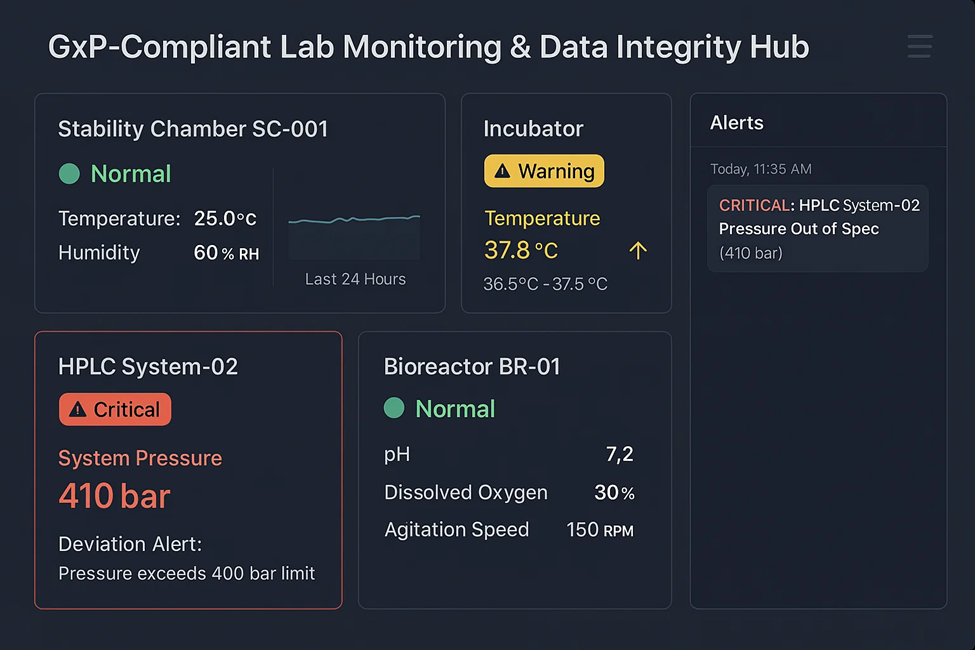
Compliance dashboard for real-time GxP insights
The dashboard is a live source for a centralized view of all critical equipment and parameters under control. Laboratory managers can see the status of every asset at a glance – any parameter that approaches a threshold is flagged in yellow and turns to red upon deviation, thus providing an immediate visual cue.
An automated multi-channel alert and logging
A parameter moving outside its range will trigger an automatic multi-channel alert to responsible lab personnel. What’s more, every single data point and alert is timestamped and logged into a 21 CFR Part 11 compliant database, thereby creating an auditable electronic record that satisfies regulatory requirements without requiring manual intervention.
Scenario 4: pharmaceutical manufacturing OEE monitoring & batch reporting
A facility is running a complex production line involving blenders, tablet presses, and blister packaging machines. The equipment is from different manufacturers and communicates by using industrial protocols.
The manager is struggling to oversee line performance and calculate OEE (Overall Equipment Effectiveness), which causes multiple problems:
- The identification of causes behind stoppages is impossible, which leads to losses in productivity
- The compilation of compliance batch records for evaluation is slow and requires manually gathering data from siloed systems
Our suggestion: a unified production & compliance dashboard – a central data hub for the entire line.
Multi-protocol integration
Node-RED is a universal industrial gateway:
- We use specific nodes to connect to the PLCs (Programmable Logic Controllers) of each used machine
- And pull the data by using native protocols: Modbus from the blender, OPC UA from the tablet press, Siemens S7 from the packaging machine
OEE calculation & visualization in real-time
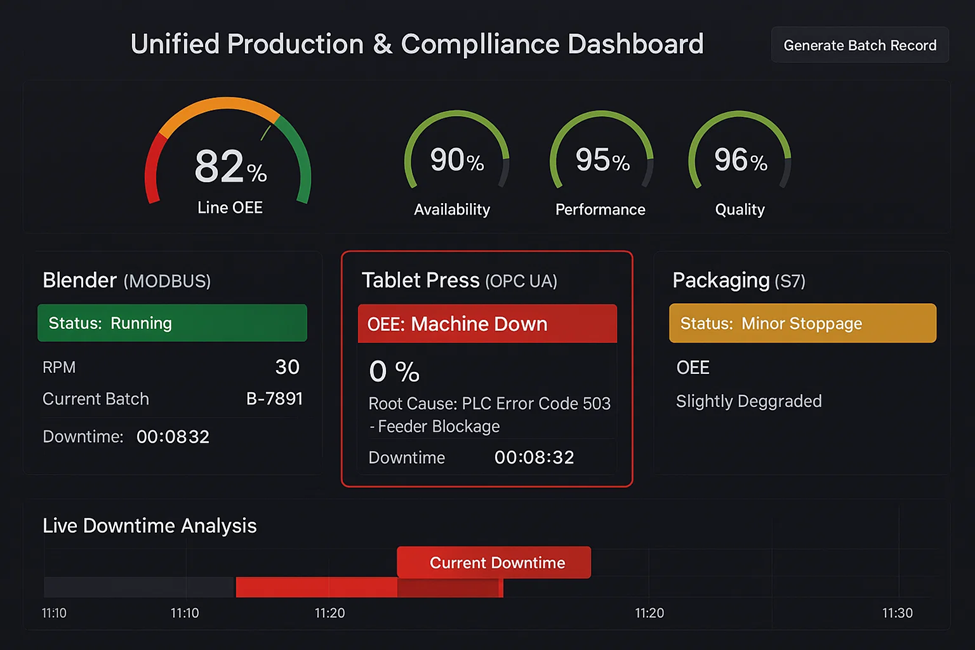
- The implemented Node-RED flow continuously processes the incoming machine data (cycle counts, machine state, error codes) to calculate OEE accurately in real-time
- A dashboard at the supervisor’s station, at the same time, displays the OEE scores for the entire line and each individual machine by using clear gauges and trends to highlight bottlenecks instantly
A smart “Andon” system & root cause analysis
A piece of equipment that stops is flagged on the supervisor’s dashboard right away (a digital Andon system). What’s more, the flow also captures the specific error code and logs the downtime in a database automatically, which creates a dataset for root cause analysis and allows proactive response.
Batch records
As batches are progressing, the system also collects and stores all relevant production parameters and events. At the end of the run, the system can generate a comprehensive electronic summary, including timestamps, machine performance, and any alarm events, thereby minimizing manual effort.
Scenario 5: intelligent response and automation of workflows
A patient case unit in a regional hospital is facing a critical everyday challenge associated with “alert fatigue”. The nurses are flooded and stressed with constant alarm streams from dozens of dispersed bedside monitors and their standard nurse call system.
There’s no intelligent prioritization:
- This noise desensitizes staff, which increases the risk critical events might be either delayed or missed
- What’s more, many processes (the tracking of patient response times and escalating unanswered calls) is managed manually only, which increases data gaps and safety
Our suggestion: a hub to enable intelligent response to patients and automation of workflows.
HL7-compliant clinical data integration
Node-RED’s ability for clinical data processing is what we leverage in the first place:
- Data integration – we use specialized nodes to connect to dispersed bedside monitors
- Data intake in real-time – we receive data streams via the HL7 protocol
What’s more, the system can access specific values, not just generic alarms, which enables smarter responses.
Triage & escalation workflows
A visual Node-RED flow is used to replace the generic alarm system and provide an intelligent triage engine:
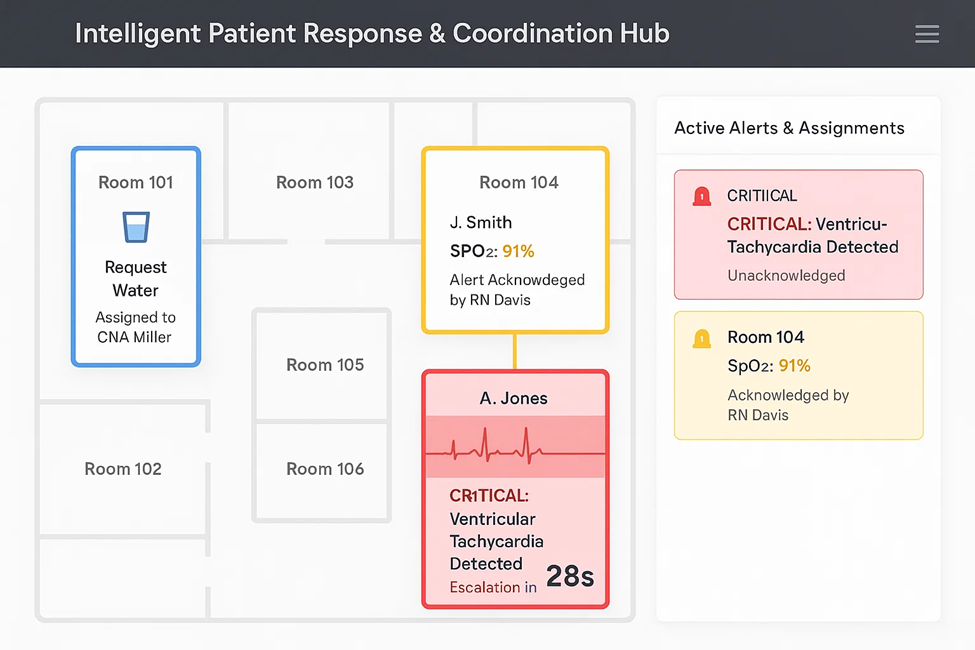
- Low priority: a request for water is routed as a push notification to the nursing assistant
- Medium priority: a patient’s SpO2 level falling below their threshold is sending a silent, detailed alert to the nurse’s smartphone
- High priority: a critical arrhythmia detected via the HL7 channel will generate an instant audible alarm with the ECG values on the main screen at the nursing station and escalate to the nurse that’s in charge if not acknowledged within 60 seconds
Ward dashboard
A dashboard is used to display each room, a summary of patient vital signs, and alerts that wait for response. The dashboard clearly visualizes who acknowledged and provides a countdown for escalation, thereby ensuring immediate awareness and accountability.
How we can help
Node-RED provides a flexible, open-source environment for automating complex workflows across industries. However, making it scalable and enterprise-ready does require more than just assembling prebuilt nodes.
We use Node-RED as the foundation for strategic business systems rather than isolated flows.
Business logic that meets your needs
We don’t rely only on standard community nodes, we develop custom logic that address business challenges – our teams don’t force yours into rigid templates.
Interfaces designed for usability
Powerful backend is paired with polished, low-code front-end and dashboards that have reusable components, which simplifies employee training and allows smooth adoption.
Seamless integration across the data ecosystem
We make your solution the all-in-one, central hub of your data ecosystem, seamlessly connecting to systems – from legacy SQL servers to cloud data warehouses.
Enterprise-grade scaling and reliability
Our approach is formed and tuned to ensure business solutions are built DevOps-ready with version control, easily integrated with enterprise ETL systems (for example, Microsoft Fabric), and deployed in reliable, high-availability configurations.
Why wait?
Schedule a free discovery call today to discuss your challenges and see how our Node-RED expertise can help.
Our expertise:
Our services:






 CLUTCH